


Most retail pricing is still done manually. In fact, 64% of retailers described their pricing as “largely manual and experience-led,” and only 4% used fully predictive and automated pricing. The gap between the two is more about pricing decisions than the software or budget, and shows up directly in revenue, profit margin, and perceived value.
Retail pricing maturity is the lens for that gap. It describes how far a team has moved from setting prices on instinct and spreadsheets to forecasting demand and optimizing every price for a commercial goal. Placing your team on the curve shows where you sit today, and what the next stage is worth in profitability.
This guide maps the three stages of the curve, the trap most teams get stuck in halfway up, and the cost of standing still once you can see it.
What retail pricing maturity measures
Retail pricing maturity measures how pricing decisions are made, not how good any single price is. It runs along a clear progression from manual and experience-led, to rule-based automation, to predictive and goal-driven optimization. Each step changes the inputs a price is based on, the speed at which it can respond, and the financial result.
In this context, “maturity” refers to the organization’s pricing capability, which is different from a product’s life-cycle maturity stage (the phase between launch and decline). A retailer can sell mature products and still run immature pricing. This guide is about the capability.
With most retailers still pricing manually and only a small fraction pricing predictively, the majority of teams are clustered at the bottom of the curve, using far less of their demand and transaction data than their most advanced competitors do. That clustering represents an opportunity: the further down the curve a team sits, the more margin the next stage tends to unlock.
The three stages of the curve
For each stage below, the useful questions are the same: how do decisions get made, what breaks as assortment and channels scale, and what are the tell-tale signs a team is stuck there?
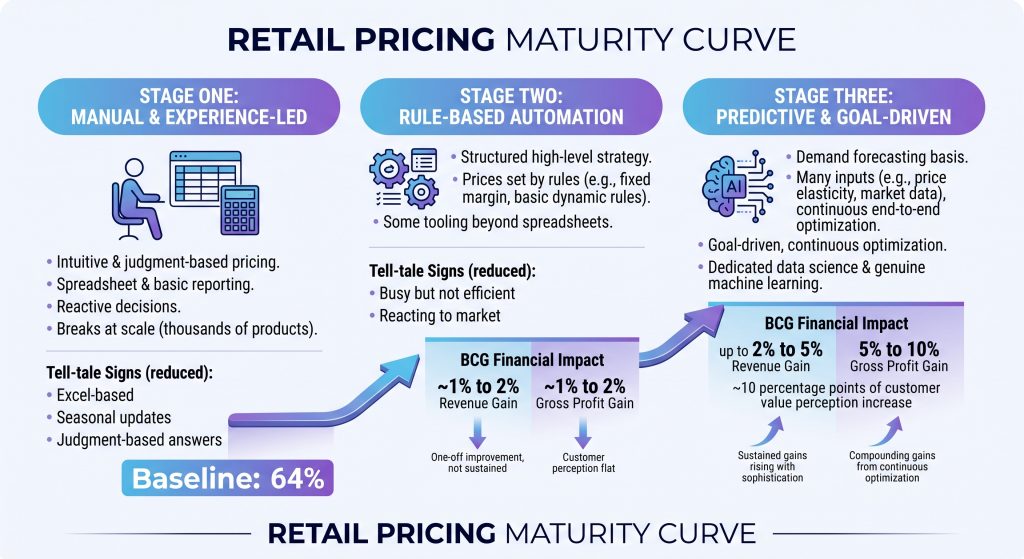
The financial pattern across the stages comes from BCG’s analysis of improving pricing capabilities, which found that retailers moving to AI-powered pricing increased gross profit by 5% to 10% while sustainably increasing revenue and improving customer value perception. The important word in that finding is sustainably, and it separates the top and middle of the curve.
Stage one: Manual and experience-led
At stage one, there is no real pricing strategy. Prices are set instinctively, defended by experience, and managed in spreadsheets with basic reporting. Decisions get made once or twice a year, or reactively when a cost or a shift in competitor prices forces the issue.
This works while the assortment is small and someone senior can hold the logic in their head. However, it breaks as SKUs, channels, and price changes multiply, because there is no way to reason about thousands of products individually.
The tell-tale signs: pricing lives in a spreadsheet, resets happen on a seasonal calendar rather than continuously, and the answer to “why is this priced here?” is a person’s judgment rather than a forecast. This is the 64%, and it is the baseline the rest of the curve is measured against.
Stage two: Rule-based automation
Stage two adds structure. A high-level strategy exists, and prices are set automatically against one or two factors, most often by matching competitors, applying a fixed margin or markup, or running basic dynamic pricing rules, with some tooling beyond spreadsheets.
BCG’s analysis puts the gain from rule-based capability at roughly 1% to 2% in revenue and 1% to 2% in gross profit.
BCG characterizes that gain as a one-off improvement rather than a sustained one, and customer value perception does not move. A rule fires the same way whether or not the market has changed underneath it, so the team spends its time maintaining and patching rules as the assortment and channel mix grow.
What breaks at scale is the rule set itself, which expands faster than anyone can keep coherent, and competitor-matching rules that pull prices into a race to the bottom. The tell-tale sign of being stuck here is a pricing function that is busy but not steering, reacting to the market rather than getting ahead of it.
Stage three: Predictive and goal-driven
At stage three, pricing runs on a demand forecast. The strategy accounts for customer and economic factors together, prices are set on many inputs at once (price elasticity, margin, competitive position, market prices, rounding), and the system forecasts the impact of a price on profit, revenue, and sell-through before it goes live.
The team sets a commercial goal, and the optimizer finds the prices that reach it, across channels, updated continuously rather than seasonally. This stage typically comes with a dedicated pricing and data science capability and a tool that genuinely uses machine learning rather than badging rules as AI.
BCG’s analysis shows that AI-powered pricing delivers sustained gains that rise with sophistication, up to 2% to 5% in revenue, 5% to 10% in gross profit, and around 10 percentage points of customer value perception at the most advanced level.
Unlike the one-off bump from rules, these gains compound because the system keeps re-forecasting and re-optimizing as conditions move. This is the 4%.
Why rule-based automation feels like progress but stalls
The jump from stage one to stage two is real, which is exactly why so many teams stop there and assume they’ve reached maturity. The reason it stalls is structural. Rule-based automation reacts to the market instead of forecasting demand or optimizing toward a goal.
An if/then rule and a competitor-matching policy both encode a decision that was already made, then execute it faster. Speed of reaction and quality of decision are different things, and only one of them compounds.
Competitor-matching makes the ceiling concrete. When the rule is “match the lowest competitor,” a rival’s markdown becomes your markdown, regardless of whether your own demand justified it, and the result on low-elasticity products is margin given away for volume you already had.
That is why BCG’s numbers show the rule-based gain arriving once and then flattening, while the predictive gain sustains: reacting faster to the same signals does not improve the underlying decision, and forecasting customer demand does.
The cost of manual pricing
For a finance audience, the gap is best read as money left on the table. In the Hive Barometer 2026, 38% of retailers named missed revenue opportunities as their biggest pricing cost and 29% named margin erosion, the two symptoms of pricing that cannot see demand coming.
Against that sits an average profit uplift of 10% to 15% or more in AB tests across 7Learnings’ fashion clients, a 7Learnings benchmark that quantifies what closing the gap is worth.
Scale does not make the recovery harder. GALERIA, a German department store running more than two million SKUs, reached ROI within two months after moving to predictive pricing, alongside a 230% revenue increase and a 50% margin uplift.
As a European result, it is a validated benchmark rather than a US-specific promise, but it shows the gap between stage one and stage three is both real and recoverable, even at enterprise scale.
How to move up the curve
Start with scenario modeling and simulation. Running “what if” forecasts on your own data, before changing a single live price, is the lowest-risk way to see what stage-three pricing would do, and retailers increasingly treat it as the on-ramp to internal buy-in for pricing AI. It turns an abstract capability question into a concrete projection a CFO can evaluate.
Specialized predictive pricing software is quicker to stand up than buyers expect. The tech lift is low, and retailers can see first ROI within only a few weeks.
Before you evaluate tools, understand what retailers most often get wrong about AI. Our ultimate guide to predictive pricing covers this alongside how stage-three pricing works in practice.
A platform like 7Learnings is one example of a stage-three approach: demand forecasting first, goal-driven optimization on top, with the projected impact of every price visible before it goes live.
Find your stage, then cost the gap
Retail pricing maturity comes down to whether decisions get made on instinct, rules, or a forecast. Knowing which your team is on tells you what standing still is costing you, since the financial gap between the stages is measurable and, on the evidence, sizable.
Once you know which stage your team is on, the next question is what the gap to stage three is worth. The 7Learnings profit uplift calculator turns that gap into a profit figure in a few minutes. Size the opportunity before you build the internal case.
Frequently asked questions about retail pricing maturity
What is retail pricing maturity?
Retail pricing maturity describes how advanced a retailer’s pricing decisions are, measured by how those decisions get made rather than by any single price. It runs from manual and experience-led pricing, through rule-based automation, to predictive and goal-driven optimization that forecasts demand before prices go live.
The concept is about organizational capability, and it is separate from a product’s life-cycle maturity. Where a team sits on the curve is a strong predictor of how much margin its pricing is leaving unclaimed.
What are the stages of the retail pricing maturity curve?
There are three. Stage one is manual and experience-led, where prices are set on instinct and managed in spreadsheets. Stage two is rule-based automation, where prices follow if/then rules or competitor matching and deliver a one-off lift of roughly 1% to 2% in revenue and gross profit.
Stage three is predictive and goal-driven, where demand forecasts and optimization drive prices toward a commercial goal and deliver sustained gains, which BCG’s analysis puts as high as 5% to 10% in gross profit at the most advanced level.
How do I know which pricing maturity stage my company is in?
Look at how your prices actually get set. If they live in spreadsheets and change once or twice a year on judgment, you are at stage one. If they update automatically from rules or competitor matching but your team spends its time maintaining those rules, you are at stage two.
If prices are set by a demand forecast optimized toward a defined profit, revenue, or sell-through goal, and you can see the projected impact before a price goes live, you are at stage three. Most retailers sit at stage one or two.
Is rule-based pricing considered mature?
Rule-based pricing is a step up from manual pricing, but it is not the top of the curve. It automates execution without forecasting demand or optimizing toward a goal, so its gains tend to arrive once and then flatten, and it can lock a retailer into reactive competitor-matching.
BCG’s analysis shows the sustained revenue, gross profit, and customer-perception gains coming from AI-powered, predictive pricing rather than from rules. Rule-based automation is best understood as the middle of the maturity curve, not its end.